VWAP
Definition of Volume Weighted Average Price
Volume-Weighted Average Price (VWAP) is a trading algorithm based on a pre-computed schedule that is used in the execution of a bigger order to minimize the impact on the market price.
In the book “Algorithmic & Trading DMA” we can read about VWAP that “As a benchmark, it rapidly became ubiquitous since it gives a fair reflection of market conditions throughout the day and is simple to calculate. This led to algorithms that tracked the VWAP benchmark becoming extremely popular.”
Before diving into the details of VWAP calulations and its appliance as a trading strategy, let’s look at this interesting short video on algorithmic trading in general.
VWAP as an Indicator and Its Formula
The schedule is the heart of a algorithmic trading strategy. To compute the schedule, the strategy should first look into historical data. As an input user defines  the Number of Intervals and delay between each two of them. This gives us a partition of the period since Start Time until End Time into intervals
  . Using the historical data strategy have to estimate how a big fraction of a volume traded between Start Time and End Time is traded in each time interval – these values are denoted by
  for each time interval
  .
.
Notice that the following holds:

 for each value of
On a base of the above considerations, the strategy can estimate the size of a trade that should be traded at the end of each time interval to minimize the market price strategy’s self-impact. For a  -th time interval it is defined as follows:

Larger market participation does more impact on a market asset’s price weighted by volume, which is expressed by the formula:
where is every trade. Therefore strategy tries to keep steady market participation in each of intervals.
If, defined above, predictions of volume fractions in each interval are proper then the algorithm works perfectly, otherwise it can cause a considerable impact on a market price. To prevent this bad situation more advanced versions of this algorithm take into the account also actual volume and modify their schedule to fit the market conditions.
VWAP as a Trading Strategy
Market Data
- Last trade
- Best quote
- Order book
- Statistics
- Historical market data
Algorithm Parameters
| PARAMETER NAME | DESCRIPTION | ESSENTIAL |
|---|---|---|
| Target Quantity | Overall quantity to be realized by strategy | Yes |
| Number of Intervals | Number of intervals to be used | Yes |
| Delay Table | Delay times between following orders | Yes |
| Start Time | A time when strategy begins to submit orders | Yes |
| End Time | A time when strategy stops working | No |
| Side | Market side for orders | Yes |
Algorithm Conditions
Open position
 defined in the Description)
The strategy opens positions every time the delay value is reached.
Close position
The strategy does not close its opened positions.
Termination
Strategy ends when the declared orders’ quantity has been realized. By design around defined End Time.
Time frame
This strategy is dedicated to being used in a short period of time like one day.
Calculations used in trading strategy
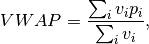
Calculation of VWAP it’s relatively simple and was described at the begging of the article. In mathematical approach VWAP is represented by the equation below:
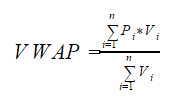
where P is the price of i-th trade and V is the size related to i-th trade. In fact, it takes five steps to calculate your first VWAP. First, only if we use intraday data for examination, we need to calculate the typical price for our intervals. Then multiply the price by period’s volume and create a running total of these values for future trades. Fourthly we create cumulative volume and in the end, we divide cumulative multiplication of price and volume by running a total of volume to obtain VWAP. Even simpler, VWAP is a turnover divided by total volume.
About empirica
We help crypto projects build liquid markets for their tokens. We are a trading technology and market making company specializing in building advanced low-latency systems to support providing liquidity on crypto markets.
Let’s take a look at example results calculated using these five steps on 1-minute interval intraday Morgan Stanley’s data.
| Time | Close | High | Low | Open | Volume | Typical Price | Price*Volume | Total PV | Total Volume | VWAP |
| 09:30:00 | 38.90 | 38.96 | 38.90 | 38.96 | 69550 | 38.93 | 2707581.50 | 2707581.50 | 69550.00 | 38.930 |
| 09:31:00 | 38.94 | 38.97 | 38.86 | 38.92 | 27617 | 38.92 | 1074922.68 | 3782504.18 | 97167.00 | 38.928 |
| 09:32:00 | 38.91 | 38.96 | 38.91 | 38.94 | 11441 | 38.93 | 445398.13 | 4227902.31 | 108608.00 | 38.928 |
| 09:33:00 | 38.89 | 38.94 | 38.88 | 38.92 | 23587 | 38.91 | 917710.61 | 5145612.93 | 132195.00 | 38.924 |
| 09:34:00 | 38.90 | 38.94 | 38.90 | 38.90 | 10771 | 38.91 | 419099.61 | 5564712.54 | 142966.00 | 38.923 |
| 09:35:00 | 38.97 | 38.97 | 38.90 | 38.90 | 12721 | 38.93 | 495276.23 | 6059988.77 | 155687.00 | 38.924 |
| 09:36:00 | 38.92 | 38.96 | 38.92 | 38.96 | 16471 | 38.94 | 641384.86 | 6701373.63 | 172158.00 | 38.926 |
| 09:37:00 | 38.90 | 38.93 | 38.86 | 38.93 | 23788 | 38.91 | 925472.14 | 7626845.77 | 195946.00 | 38.923 |
| 09:38:00 | 38.90 | 38.92 | 38.89 | 38.89 | 9170 | 38.90 | 356701.54 | 7983547.30 | 205116.00 | 38.922 |
| 09:39:00 | 38.92 | 38.92 | 38.88 | 38.91 | 4644 | 38.91 | 180682.02 | 8164229.32 | 209760.00 | 38.922 |
| 09:40:00 | 38.90 | 38.92 | 38.88 | 38.91 | 4917 | 38.90 | 191283.59 | 8355512.92 | 214677.00 | 38.921 |
All calculations are pretty straightforward, but let us take a look at one interesting element. When you look at typical prices more than half of them (7/11) is below the last VWAP At the same time mean equals 38.917. So where does the difference come from? Volume is the culprit. In our case, a period with the higher typical price also has a bigger Volume, thus bigger market impact and VWAP calculations indicate that.
Intraday or tick
The most classical VWAP approach is based on tick-by-tick data. But as the market grows and the frequency of trades increases more resources are required to keep all calculations up-to-date. Nowadays it is nothing extraordinary for stock to have over a hundred trades per minute (true or false?). When multiplied by minutes in a trading day and number of stocks it develops into numbers that might cause some performance troubles.
With help arrives intraday data, i.e. tick-by-tick data aggregated in time periods e.g. 1-minute, 5-minute or 15-minute that contains the close, high, low and open price. As in VWAP calculations, only one price is required we have to somehow average available prices. For this task exist typical price:
![]()
Also, there is a second version of typical price that includes Open Price and it’s divided by 4.
Strategy
Most likely we can point out two different strategies of reading VWAP. The first one used especially by short-term traders relies on waiting for VWAP to cross above the market price and then enter long position as they interpret price to be bullish. On the other hand, are Institutions looking to sell at this moment because they consider it a good opportunity for that day’s price.
When the price goes below VWAP value, the trend seems to be down. Institutions recognize it as a good moment to buy, but the short-term trader will look to short that stock.
Surely it’s a basic approach to VWAP interpretation. For your strategy, you would like to scrutinize e.g. the influence of price deviation from VWAP value. You should consider that VWAP behaves differently based on a period of the trading day. It’s because of VWAP cumulative nature. VWAP value is very sensitive for price changes at the beginning of the day, but insensitive at the end of the trading day.
Big Fish
VWAP is surely commonly used between traders with strategies described above, but on the market, there is a bunch of various indicators like VWAP that can suggest when to buy or sell shares. But there is another side of the fence.
Let’s say you want to buy 5 million shares of Morgan Stanley that is 37% of average daily volume in 2014. You cannot buy them at once, because that will impact significantly the market and the market will start to go against you. What you want to do is split the order in small pieces and execute them without impacting the market. Doing it by hand would be backbreaking, that’s what trading application has been made for.
Using trading application and VWAP Strategy, utilizing historical minute intraday files, you can easily generate average volume period profiles that will steadily buy the proper number of shares without impacting the market.
Improve your VWAP
As we mentioned in the previous paragraph there is a way to improve VWAP performance by creating volume profiles based on historical data. According to Kissel, Malamut and Glantz optimal trading strategy to meet the VWAP benchmark can be obtained by using the equation:
![]()
where X is the total volume traded, ![]() is the percentage of daily volume traded and
is the percentage of daily volume traded and ![]() is target quantity for each j-th period. Hence, VWAP can be calculated as below:
is target quantity for each j-th period. Hence, VWAP can be calculated as below:
![]()
where![]() is the average price level in each period.
is the average price level in each period.
Summary
VWAP is a really simple indicator although it can be interpreted in various ways depending on the goal and approach of the trader. It is mainly used by mutual and pension funds, but also by short-term traders. Aside from buying/selling a small amount of shares, VWAP might be used as a strategy for trading a huge number of shares without impacting the market. “Simplicity leads to popularity.”
References
- Berkowitz, S., D. Logue, and E. Noser. “The Total Cost of Transactions on the NYSE.”Journal of Finance,41 (1988), pp.97-112.
- H. Kent Baker, Greg Filbeck. “Portfolio Theory of Management” (2013) , pp.421
- Barry Johnson “Algorithmic & Trading DMA – An introduction to direct access trading strategies” (2010), pp. 123-126
Recommended readings:
Basket Orders, Bollinger Bands, CSI, MACD, Market Close, Parabolic SAR, POV, RSI, Slow Stachastic Osilliator, Statistical Arbitrage, TWAP, VWAP, Adoptive Shortfall, Triangular Arbitrage

